Is Your Solar System Running on a Flat Tire?
So, you’ve either just made the leap or you’ve been driving on the same tires for a while now. Panels are on the roof, the sun is shining, and you’re ready to watch those electricity bills plummet. But here’s a question most homeowners forget to ask: How do you actually know your system is working at 100%?
Think of solar monitoring like the TPMS (Tire Pressure Monitoring System) in your car. When your tire is flat, the light turns on. You can still drive on a tire that’s dangerously low on air but it’ll just be sluggish, ruin your gas mileage, and eventually cause a blowout. Monitoring is your “dashboard alert” that ensures you aren’t dragging your efficiency through the dirt.

Why Monitoring is Your System’s “Dashboard Alert”
Solar energy is famously “set it and forget it,” but even the best tech needs a watchful eye to maintain peak performance. Monitoring provides three critical “safety nets” for your investment:
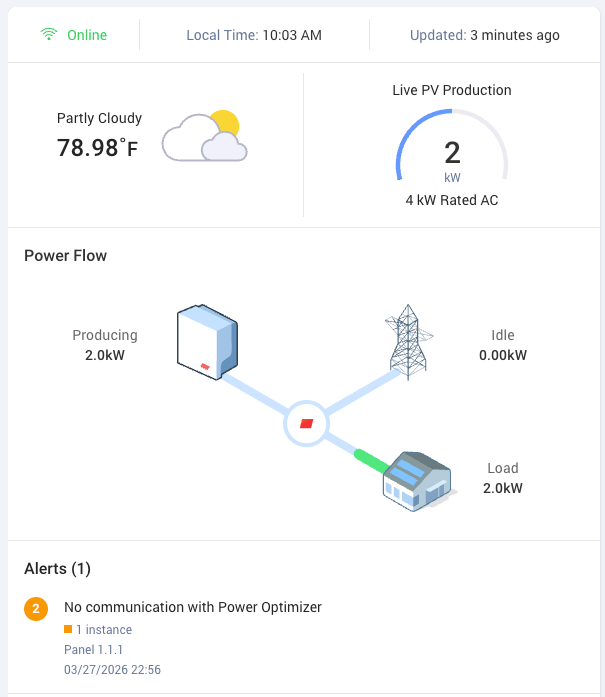
- Catching the “Flat Tires”: A single tripped breaker or a faulty inverter can shut down your entire system. Without monitoring, you might not notice a drop in production until a massive utility bill arrives 30 days later. That’s the equivalent of driving on a rim.
- Maximizing Your Fuel Efficiency: Monitoring shows you exactly when your panels are peaking. If you know you produce the most power at 1:00 PM, you can time your dishwasher or laundry to run then, ensuring you use your “free” energy instead of pulling from the grid.
- Tracking Engine Health: All panels age, but tracking performance helps you distinguish between normal wear-and-tear (typically less than 1% per year) and actual hardware issues or excessive dirt buildup.
Getting Under the Hood: What You Can Do Yourself
If you want to take a hands-on approach to your system’s health, there are several “maintenance checks” you can perform. Self-monitoring isn’t just about looking at a single number; it’s about understanding the “why” behind the data.
1 Master Your App’s Granularity
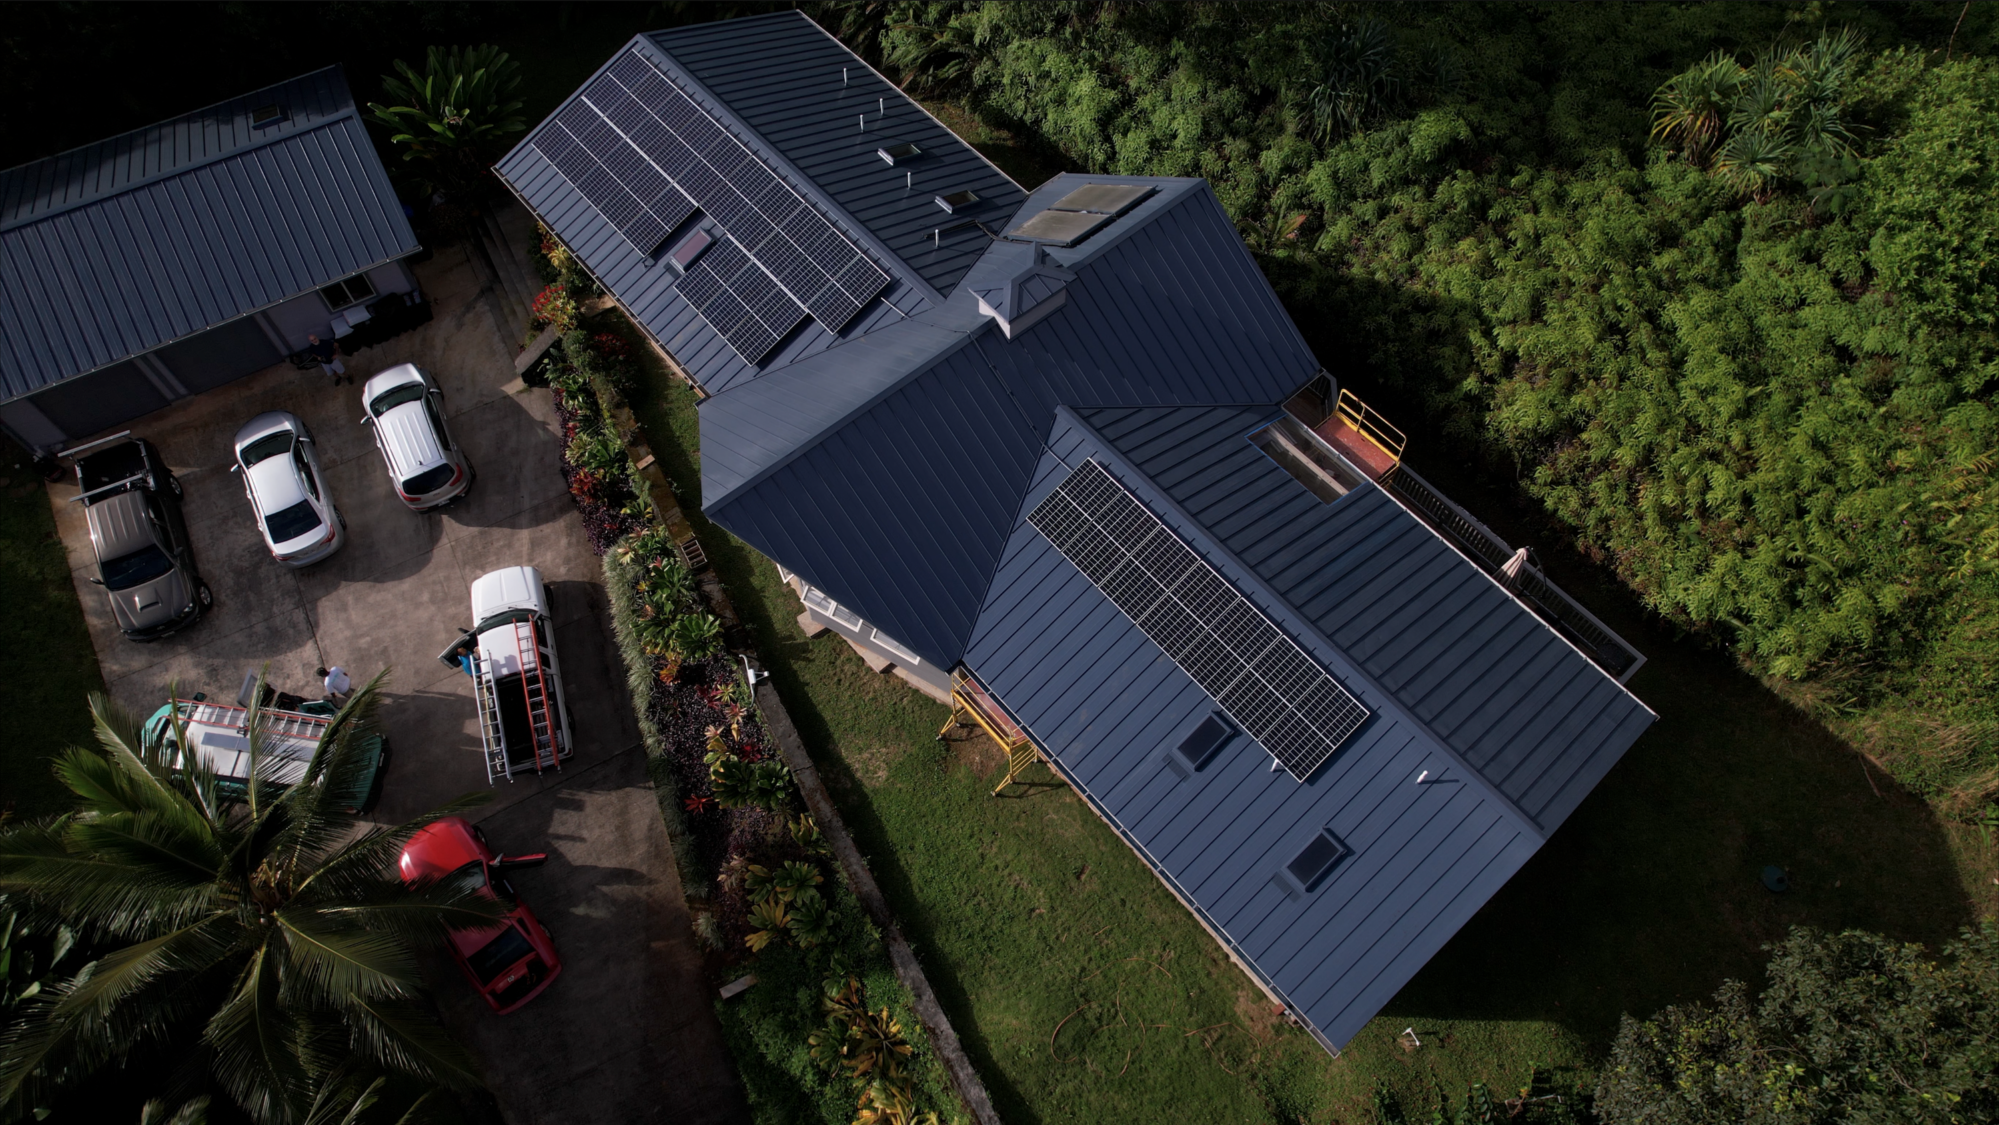
Most modern systems offer module-level monitoring. Don’t just look at the total daily production. Periodically check the individual panel map. If 19 panels are dark blue but one is light grey, you’ve found a “flat tire”—likely a single microinverter issue or a specific spot of heavy bird droppings.
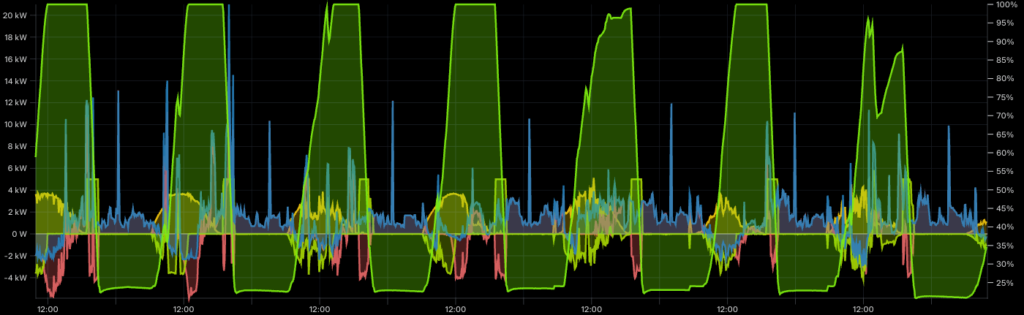
2 Perform a “Weather-to-Wattage” Audit
One of the best DIY checks is to correlate your data with the local forecast. On a perfectly clear “Bluebird Day” in Hawaii, your production curve should look like a smooth, symmetrical bell. If you see “jagged” drops or flatlines on a day with zero clouds, that’s a red flag that something—like a communication error or a heat-related clipping issue—is interfering with your output.
3 Reconcile Your Utility Bill
Your solar app tracks what you produce, but your HECO bill tracks what you export. If your app says you’re producing plenty of power but your bill is skyrocketing, you might have a “vampire load” in your house—like an old, inefficient refrigerator or a water heater setting that’s gone rogue.

The Reality Check: Is It Hard to Do?
If you enjoy logging into apps, deciphering kilowatt-hour (kWh) graphs, and cross-referencing your Hawaiian Electric bill with your production data, monitoring can be a rewarding hobby.
However, for most of us, life gets in the way. It’s easy to forget to check the app for a month, and that’s usually exactly when something goes wrong and a heavy storm is the indicator that something is not right. Interpreting the data can also be tricky! Is your production lower because of a cloud, or because a specific microinverter is failing?
Let Mālama Solar Be Your Pit Crew
At Mālama Solar, we believe our responsibility doesn’t end at installation. it starts with making sure your clean energy system is actually doing its job every single day.
We offer professional monitoring options that take the guesswork out of your hands. Instead of you having to play detective, we can keep a pulse on your system for you.
Why choose Mālama Solar monitoring?
- Proactive Alerts: We often spot a “low pressure” alert in your production before you do.
- Expert Analysis: We know the difference between a “cloudy day” dip and a technical fault.
- Peace of Mind: You get to enjoy the savings and the sunshine while we handle the data.
Don’t leave your savings to chance. If you want to ensure your system is running at peak efficiency without the headache of daily data tracking, reach out to us at Mālama Solar. We’ll keep our eyes on the dashboard so you can keep your eyes on the road.